Wind Radar Map: How to Track Live Wind Speed, Gusts, and Direction
A wind radar map is your most essential visual tool for tracking live wind speed, wind gusts, and storm direction in real time. Learn how to read wind colors, moving lines, and practical forecast tips using accurate ECMWF weather data. Dive in!
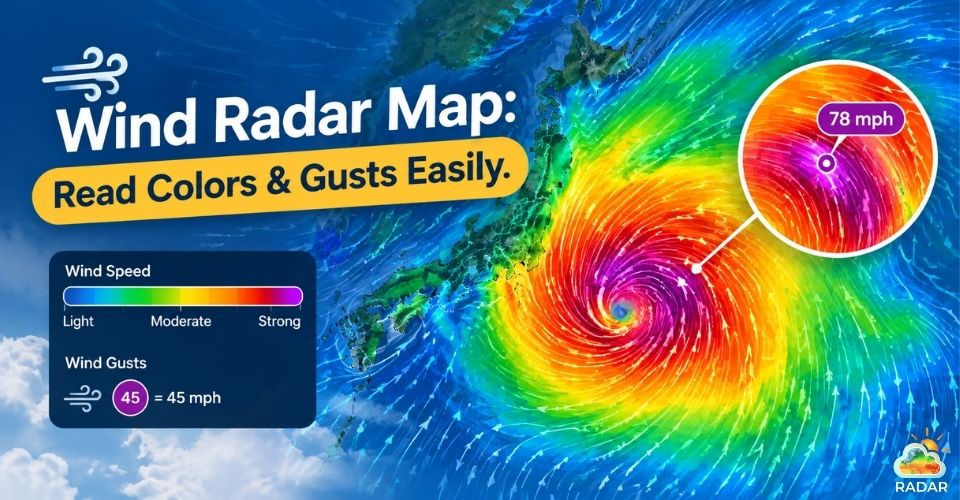
A wind radar map is used for tracking live wind speed
Understand Wind Radar Map
A wind radar map is an interactive tool that shows live wind speed and direction using colorful maps and moving lines.
Modern wind radar maps use three simple tools to stay accurate:
-
Radar & Satellites: Ground radar bounces signals off clouds to measure wind speed. Satellites track big storms over the ocean.
-
Ground Sensors & Buoys: Land stations and sea buoys measure wind and air pressure to double-check radar data.
-
Computer Models: Powerful computers take all this weather data to draw moving lines on your map and predict future wind paths.
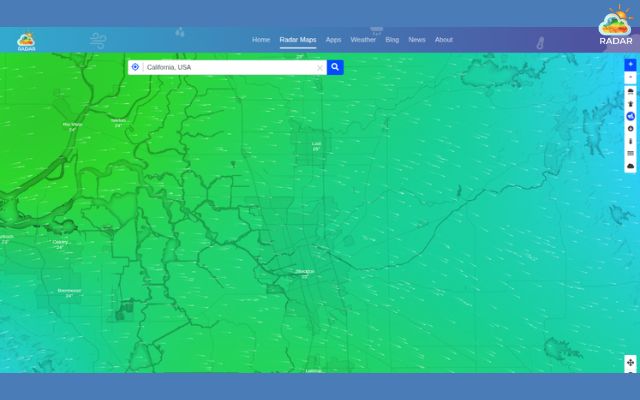
A wind radar map on GoWeatherRadar
Wind Radar Map: Color Scale & Speed Breakdown
Wind radar maps use standardized color scales to represent wind velocity. Understanding these color codes helps you evaluate outdoor safety at a glance:
|
Radar Color Code |
Speed Range (MPH) |
Speed Range (KM/H) |
Wind Description |
Outdoor & Travel Impact |
|
Light Blue / Green |
0-15mph |
0-24km/h |
Light to Moderate Breeze |
Safe for all outdoor activities |
|
Yellow / Orange |
15-35mph |
24-56km/h |
Strong Wind / High Gusts |
Difficult umbrella use; small branches sway |
|
Red / Dark Red |
35-65mph |
56-105km/h |
Gale to Storm-Force Winds |
Hazardous driving; potential tree damage |
|
Purple / White |
65+mph |
105+km/h |
Hurricane-Force Winds |
Severe structural danger; high blackout risk |
Pro Tip: Long, fast-moving lines on the map show strong, steady winds. Tight, spinning circles mark low-pressure centers or the eyes of developing storms.
How To Read a Wind Radar Map on GoWeatherRadar
To read a wind radar map on GoWeatherRadar, open the app or website, select the Wind layer from the main menu, and enter your city or zip code in the search bar.
Observe the animated moving lines for wind direction, check the color scale to gauge speed intensity, and toggle between steady wind speeds and sudden gusts.
Now let’s dive into the details!
Step 1: Turn On the Wind Layer
Start by navigating to GoWeatherRadar on your web browser or mobile app.
Click Wind on the main menu bar to activate the wind overlay, then enter your city or zip code into the search bar.
Use the + and - controls or pinch-to-zoom to switch between a detailed street-level view and a regional overview.
Step 2: Read the Colors and Movement
The live map uses moving lines and color bands to show airflow patterns in real time:
-
Moving Lines (Streamlines): The direction these animated lines flow indicates where the wind is blowing. Faster-moving lines mean stronger air currents.
-
Green / Light Blue: Represents a light to moderate breeze (0-15mph or 0-24km/h). Conditions are calm and safe for outdoor plans.
-
Yellow / Orange: Signals strong winds (15-35mph or 24-56km/h). Expect swaying tree branches and choppy water.
-
Red / Purple: Marks severe, high-speed storm winds (35+mph or 56+km/h). Exercise caution when driving or traveling outdoors.
Step 3: Check Wind Speed vs. Gusts
GoWeatherRadar allows you to toggle between two distinct wind measurement modes:
-
Sustained Wind Speed: Shows the steady, average speed of the wind recorded over a set time window.
-
Wind Gusts: Displays sudden, powerful bursts of wind lasting just a few seconds. Always check gusts to evaluate local risks like falling tree limbs, loose debris, or power outages.
Step 4: See Future Wind Forecasts
Click the Play button on the bottom timeline bar to animate wind shifts from the past few hours.
Next, switch the view from Live to Forecast mode and drag the slider forward to +6h, +12h, or +24h.
This uses high-precision ECMWF model data to show when wind speeds will peak later in the day.
Step 5: Change Units & Check Storm Centers
Customize your map settings by switching measurement units to your preference (mph, km/h, or knots).
Finally, look for tight, spinning circles on the map. These circular patterns highlight low-pressure systems, tropical storms, or approaching weather fronts.
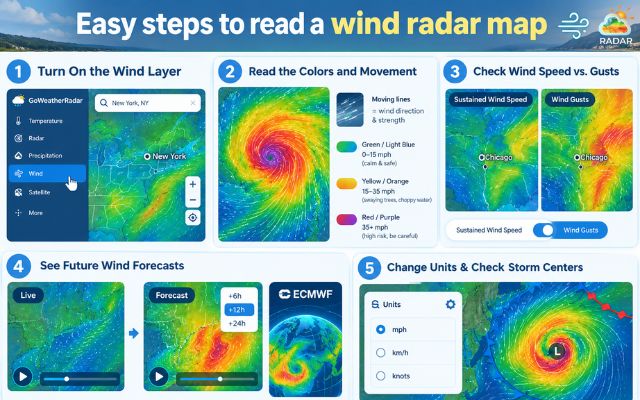
Easily check the wind radar map on GoWeatherRadar
Why You Need a Live Wind Radar Map
A live wind radar map gives you real-time wind updates for your exact area.
Instead of broad daily forecasts, it shows moving wind patterns so you can protect your home, travel safely, and plan outdoor fun with confidence.
-
Safe travel driving
High winds make driving dangerous, especially on bridges and open highways.
Checking a wind map before you drive helps high-profile vehicles like trucks, RVs, and buses avoid harsh crosswinds.
It also alerts drivers to sudden gusts that might blow debris into the road.
To stay safe while driving, do not forget to check
-
Outdoor activities & Aviation
Whether you are sailing, flying a drone, or hiking along the coast, wind speed affects your safety. A live wind map shows exact wind speeds and directions.
This helps sailors avoid dangerous gales and lets outdoor enthusiasts pick the safest time to head outside.
-
Property protection
Strong wind gusts cause massive home damage every year by downing trees and power lines.
By watching yellow, red, and purple wind bands on your screen, you get extra time to bring in outdoor furniture and park your car in the garage before a storm hits.
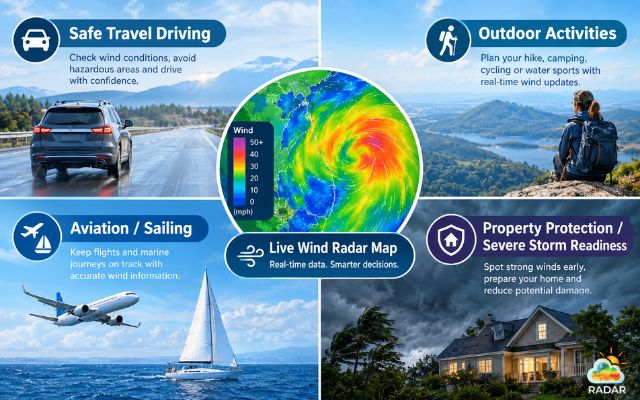
Stay safe by regularly checking the wind radar map
Sum up
Learning to read a wind radar map helps you stay ahead of sudden gusts and severe storms. By checking color codes, line movements, and live forecasts, you can protect your travel plans and secure your home. Bookmark GoWeatherRadar today to track live winds with confidence!


0 Comments
Leave a Comment
Your email address will not be published. Required fields are marked *