Learning how to read hurricane map correctly can save your life when severe weather strikes. According to National Hurricane Center data, over 60% of people misinterpret the forecast cone, putting their safety at risk. Learn how to decode track symbols, avoid critical mistakes, and protect your family today. Read on!
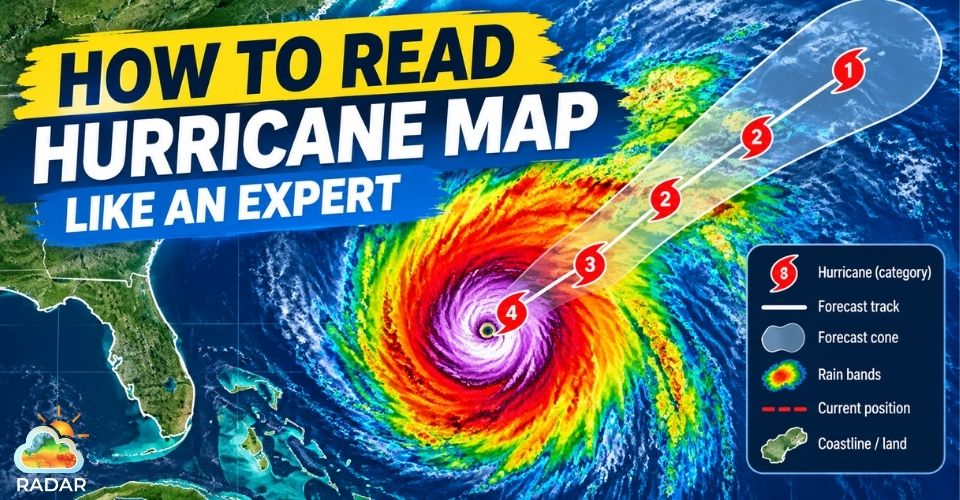
How to read hurricane map
Understanding the “Cone of Uncertainty’
The "Cone of Uncertainty" is a visual representation of a hurricane's probable track over 5 days.
It is constructed using historical forecast error circles drawn around each projected position of the storm center.
It shows where the eye of the storm might travel, not the size of the storm or the boundary of its hazards.
What Is the Hurricane Forecast Cone?
The forecast cone represents the probable track of the center (eye) of a tropical cyclone over a 5-day period.
To create this cone, National Hurricane Center (NHC) forecasters draw circles around each projected position of the storm center at 12, 24, 36, 48, 72, 96, and 120 hours.
The size of each circle is based on official forecast errors over the previous five years. A smooth line is then drawn connecting the outer edges of these circles, forming the cone.
Historical NHC data shows that the actual center of a tropical cyclone stays inside this cone about 60% to 70% of the time.
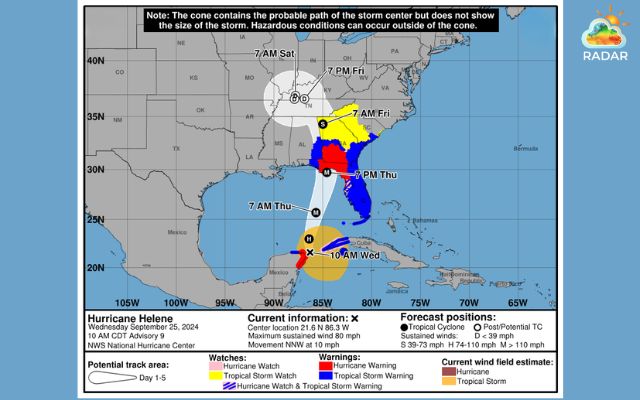
Example of a 5-day track forecast cone (Source: NOAA)
Key Takeaway: The cone tracks where the storm’s center might go—it does not show the overall size of the storm, where rain and wind will stop, or where hazardous weather will stay contained.
3 Dangerous Myths About the Hurricane Cone
Misinterpreting this simple graphic can put your home and safety at risk.
Clear up these three common misconceptions before storm season hits:
Myth 1: "Outside the cone means completely safe."
Fact: Strong winds, torrential rain, and inland flooding frequently extend hundreds of miles beyond the cone's boundaries.
Hazards do not stop at the solid line.
Myth 2: "The storm will always follow the center line."
Fact: The white line inside the cone is simply the middle path of computer forecast models.
The storm center is just as likely to travel along the outer edges of the cone as it is along the center line.
Myth 3: "The cone shows how big the storm is expanding."
Fact: The cone widens over time because forecast uncertainty increases further into the future not because the storm is physically growing in size.
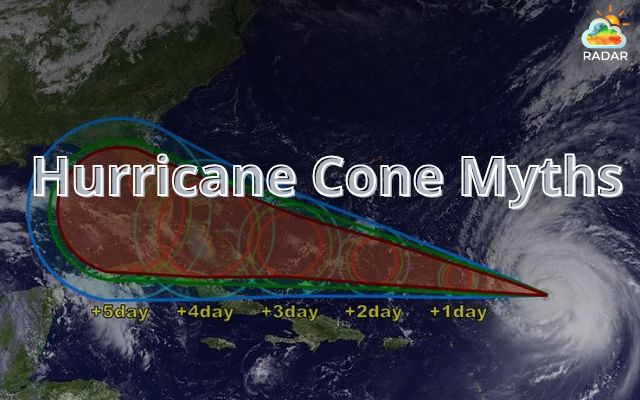
Hurricane cone myths can put you at risks
How to Read Hurricane Map: Symbols & Colors
Reading a hurricane map requires decoding letter markers (D, S, H, M) for storm intensity and coastal color bands for alert levels.
Letters show predicted wind speed at specific forecast points, while color-coded coastal borders indicate active Hurricane Watches (prepare) or Warnings (take immediate action).
Storm Intensity Letters
Forecast maps use letter markers to show the storm’s predicted intensity at specific time intervals. Here is what those letters stand for based on sustained wind speeds:
|
Symbol |
Classifiation |
Sustained Wind Speed |
|
D |
Tropical Depression |
Under 39 mph (< 62 km/h) |
|
S |
Tropical Storm |
39-73 mph (63-118 km/h) |
|
H |
Hurricane |
74-110 mph (119-177 km/h) (Category 1-2) |
|
M |
Major Hurricane |
Over 110 mph (>178 km/h) (Category 3+) |
Note: These letter markers indicate intensity at specific forecast points, helping you track whether a storm is strengthening or weakening as it approaches land.
Tropical Storm vs. Hurricane Watches and Warnings
Coastal colors on tracking maps signal active alerts issued by local weather authorities.
Understanding the difference between a Watch and a Warning gives you critical time to prepare or evacuate.
|
Watch (Pink/ Yellow) |
Warning (Blue/ Red) |
|
|
Meaning |
Hazardous conditions are possible in the specified area |
Hazardous conditions are expected in the specified area |
|
Timeframe |
Issued 48 hours before expected tropical-storm-force winds arrive. |
Issued 36 hours before tropical-storm-force winds arrive. |
|
Action |
Review your disaster plan, gather emergency supplies, and check your gas tank. |
Complete all storm preparations immediately and follow local evacuation orders. |
Other Essential Features to Look For on a Forecast Map
While the forecast cone gets the most attention, a complete storm assessment requires looking at other critical hazard layers.
Wind Radii graphics (Current Wind Field)
Tropical cyclones are massive weather systems.
The Wind Radii graphic shows the actual physical extent of dangerous winds pushing outward from the storm center.
-
Orange/Red Zones: Cover areas experiencing hurricane-force winds (74+ mph).
-
Yellow/Tropical Storm Zones: Show where tropical-storm-force winds (39–73 mph) reach.
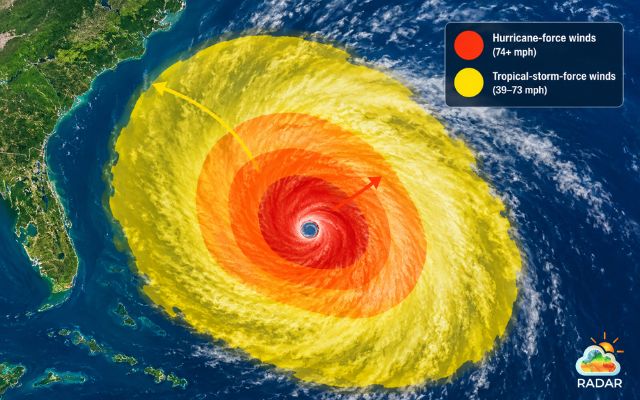
The Wind Radii overlay reveals the real physical size of the storm's wind field
Pro Tip: Tropical-storm-force winds can extend hundreds of miles from the eye. Always check wind radii to see if your area falls within the outer wind field, even if you are far outside the forecast cone.
Storm Surge Peak Inundation Graphics
Storm surge is often the deadliest threat during a hurricane landfall. This layer maps the potential height of ocean water driven inland above ground level.
-
Shows expected peak water depth in feet along coastlines and inland waterways.
-
Helps residents quickly identify if their home sits in a dangerous evacuation zone.
-
Accounts for high tides and ocean bathymetry to highlight worst-case flooding scenarios.
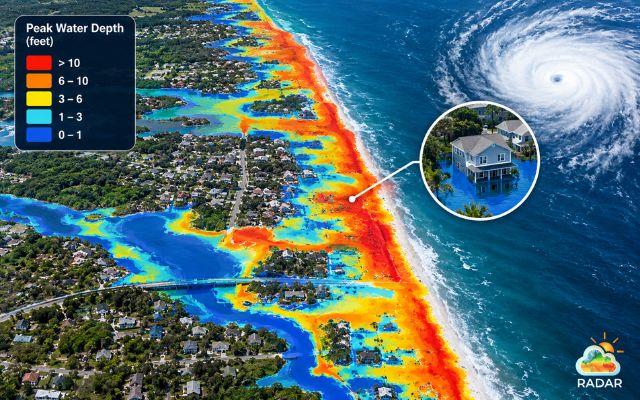
Peak inundation graphics highlight potential ocean water levels
Rainfall and Flash Flood Potential
Hurricanes carry immense amounts of moisture. High-resolution rainfall maps outline total expected precipitation over a multi-day period.
-
Highlights potential flash flooding zones well ahead of storm arrival.
-
Identifies severe inland flooding risks, which frequently occur hundreds of miles away from coastal landfall points.
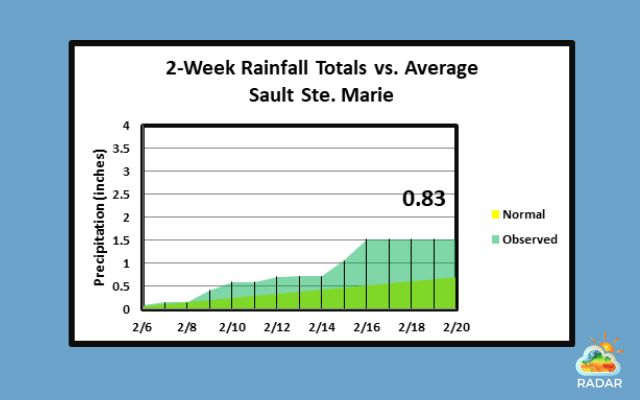
Multi-day rainfall graphics identify total precipitation forecasts
Track Real-Time Wind & Radar with GoWeatherRadar
While static NHC graphics update every 6 hours, live tracking platforms like GoWeatherRadar allow you learn how to read hurricane map by monitoring wind gusts, rain bands, and storm movement in real time.
By layering interactive wind radii and live Doppler radar over the official forecast cone, GoWeatherRadar helps you visualize how far tropical-storm-force winds actually extend from the eye.
This will give you a clearer picture of incoming conditions between official advisory updates.
How To Track a Hurricane Step-by-Step
Tracking a tropical system effectively requires a systematic approach. Follow these four steps whenever a storm threatens your region:
-
Step 1: Locate the current position of the storm center
Find the latest symbol (D, S, H, or M) showing the storm's current location. Note its movement speed and heading to understand how fast the system is traveling.
-
Step 2: Check the forecast track and arrival time
Examine the white center line and projected time stamps along the cone.
Look at the earliest reasonable arrival time of tropical-storm-force winds so you know when outdoor preparation work becomes unsafe.
-
Step 3: Review active local warnings (Watch vs Warnings)
Check the coastal color codes along your shoreline. Determine whether your local area is under a Watch (prepare) or a Warning (take action).
-
Step 4: Check every 6 hours for updated advisory products (5AM, 11 AM, 5 PM, 11 PM EDT)
Official forecast products update four times daily at 5 AM, 11 AM, 5 PM, and 11 PM EDT (or EST).
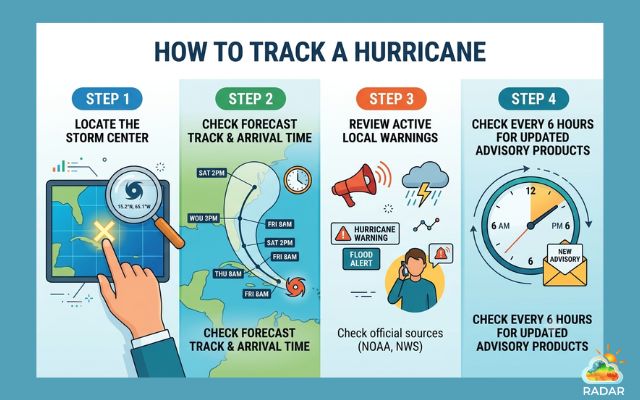
Following a systematic 4-step tracking routine ensures you stay updated on path shifts
To ensure you never miss a path change, use an interactive tracker like GoWeatherRadar.
You can save your location, set severe weather alerts, and cross-reference live radar imagery with the latest NHC advisory maps right from your phone or desktop.
Sum up
Learning how to read hurricane map graphics empowers you to evaluate real-time weather risks accurately without falling victim to common misunderstandings. Always rely on official updates from the National Hurricane Center, local National Weather Service offices, and local emergency management officials when making evacuation and safety plans.
◉ Total destruction of a high percentage of framed homes (roof collapse and wall failure).
◉ Complete power grid failure and blackout conditions lasting weeks or months.
◉ Fallen trees and power lines isolating entire neighborhoods.
◉ Most of the impacted area will be uninhabitable for weeks or months.


0 Comments
Leave a Comment
Your email address will not be published. Required fields are marked *